Slicers allow you to create different versions of a published document with data that is filtered according to your "slicer selections." For example, you can add a Country slicer to your publication and set up interactions between it and a number of visuals describing Sales data; when the publication is exported or a subscription runs you can select, say, USA from your slicer to create a document where all Sales visuals show the relevant data for the USA only.
In effect, this functionality allows you to create a "template" in Publish Lite and then use slicers and the Interaction Manager to manage how the visuals, placeholders, and so on in the document will be populated when the publication is built from that template. This can produce hundreds or even thousands of published report variations.
Adding a slicer to your publication
Use this option to build slicers on the fly, or to filter your publication by elements from other data models.
Before you begin
You would typically add slicers to your publication after you have added one or more other content items to your pages. This usually means adding existing visuals that were created in Discover or creating new "one off" visuals locally in the publication (using Discover Lite or Smart Reporting).
Note: If a visual includes its own slicer (typically added during creation in Discover or Smart Reporting), its default filter is preserved when added to a publication. For example, a pie chart filtered by Manufacturer will retain the original selection (say, ACME). To override this selection, add a new slicer with the same data hierarchy to the publication and create an interaction between the visual and the new slicer.
Step 1: Creating a new slicer
From the Toolbox:
- Click Add New Slicer (purple arrow below).
- Select the relevant hierarchy from the options in the Choose Model and Choose Data panels.
The New Slicer panel opens.
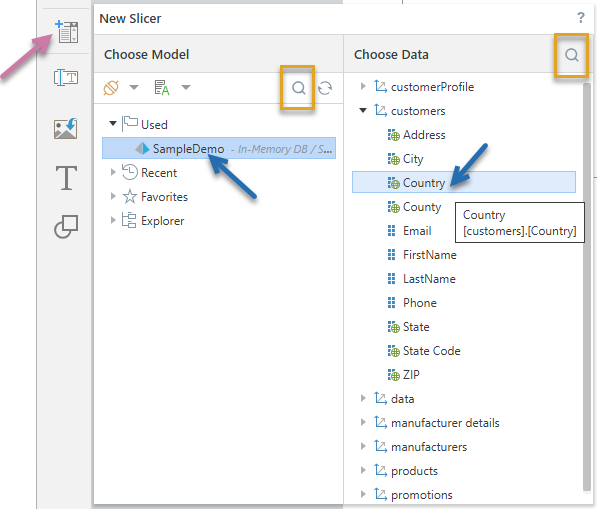
The preceding example shows the selection of the Country hierarchy from the SampleDemo model (blue arrows above). Note that the model has been "Used" in the publication already. Tip: If you know the name of your Model or Data hierarchy, you can search for it using the search options (orange highlights).
When you click on the hierarchy that you want to use as your slicer, the New Slicer panel closes and Interaction Manager opens. You will create "interactions" between your new slicer and the various content items in this panel.
Step 2: Creating slicer interactions
From the Interaction Manager, select the relevant checkboxes to create interactions between your slicers and the content items in your presentation:
- If you do not want the slicer to affect a content item in the built publication, do not select the checkbox between the slicer and the content item (green arrow below).
- If you want the slicer to affect a content item in the built publication, select the checkbox between the slicer and the content item. The example shows that the Nation slicer affects the Sales by Promotion pie chart (purple arrow) and PlaceHolder1 (orange arrow).
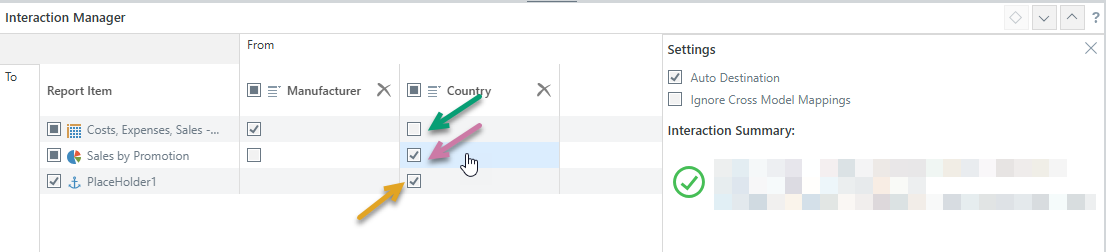
Tip: You can pin the Settings panel in the Interaction Manager to keep it open while you work. Click the Pin icon (blue arrow above) in the header to pin the panel. The panel will remain open until you unpin it.
- Click here for more information about the Interaction Manager
- Click here for more information about Dynamic Placeholders
Step 3: Testing your slicer
You should build your publication in an appropriate format to test that your slicers are applied correctly:
Open the Print & Export dialog
To open the Print & Export dialog, do one of the following:
- Click Run (top-left) or press F2 on your keyboard.
- Click Print from the Status bar (top-right, above the canvas).
- Type
printinto the Chatbot and press Enter.
Export the Publication
To configure your print:
- From the Output tab, select the document format you want and any settings associated with that format:
- Click the Slicers tab and choose the values you want your slicers to take in the published document.
- Click Export.
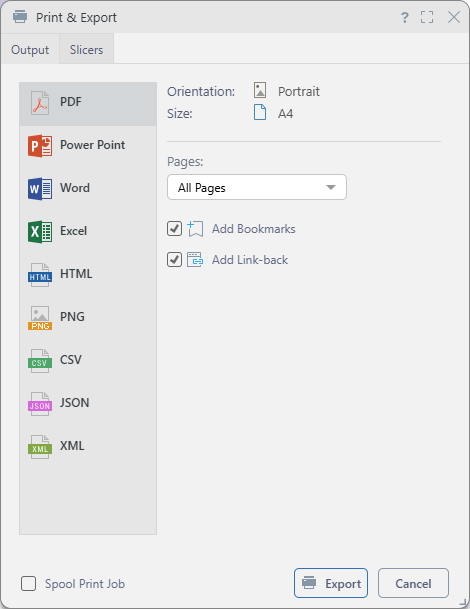
Tip: You should select the typical output for your publication when it is distributed, we recommend building a PDF in the first instance.
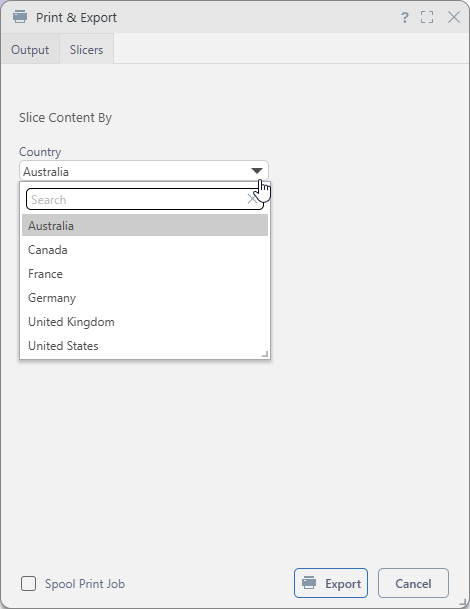
Note: Depending on the publication design, slicers can be date pickers, dropdown lists, or trees, and may allow single or multiple selections. Where multiple slices are selected, any affected content items reflect the combined data for all selections. For example, choosing three countries from a multi-select dropdown list displays data for all three in the visual.
Pyramid builds the publication in the format selected and with the settings specified for the format type and slicers.
You should check that the slicers you selected affected the publication as you would expect. For example, if you select to show only Sales information relating to Manual workers, you should check that the breadcrumb trails showing the filtering reflect your selection.
Tip: If you use Publish Lite (typically, if you are an Analyst), you cannot add advanced or multi-select slicers to your own publications. You are most likely, therefore, to see these options when you print publications created by other users in Publish Pro. For information about these advanced settings, see Slicer Settings in Publish Pro.
Managing existing slicers
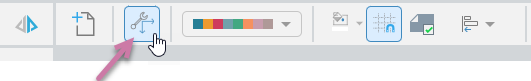
You can manage your slicers and their interactions with other content items (visuals, placeholders, and so on) with the Interaction Manager. The Interaction Manager is opened from the overhead ribbon (purple arrow below):
The following management actions can be completed with the Interaction Manager:
- Create and remove interactions between slicers and other content items.
- Delete slicers from the publication.
- Configure interaction settings.
- Click here to learn more about the Interaction Manager